
Contour lines: The enigma of terrain profiles
Just imagine yourself surrounded by breathtaking mountain scenery, holding a hiking map as you plan your route to the next mountain hut. While the trail to the hut is marked on the map, you can’t spot it out from your current position.
In this blog post, learn how to read contour lines, calculate differences in altitude, and to identify mountains, valleys, and hills. Become an orientation expert!
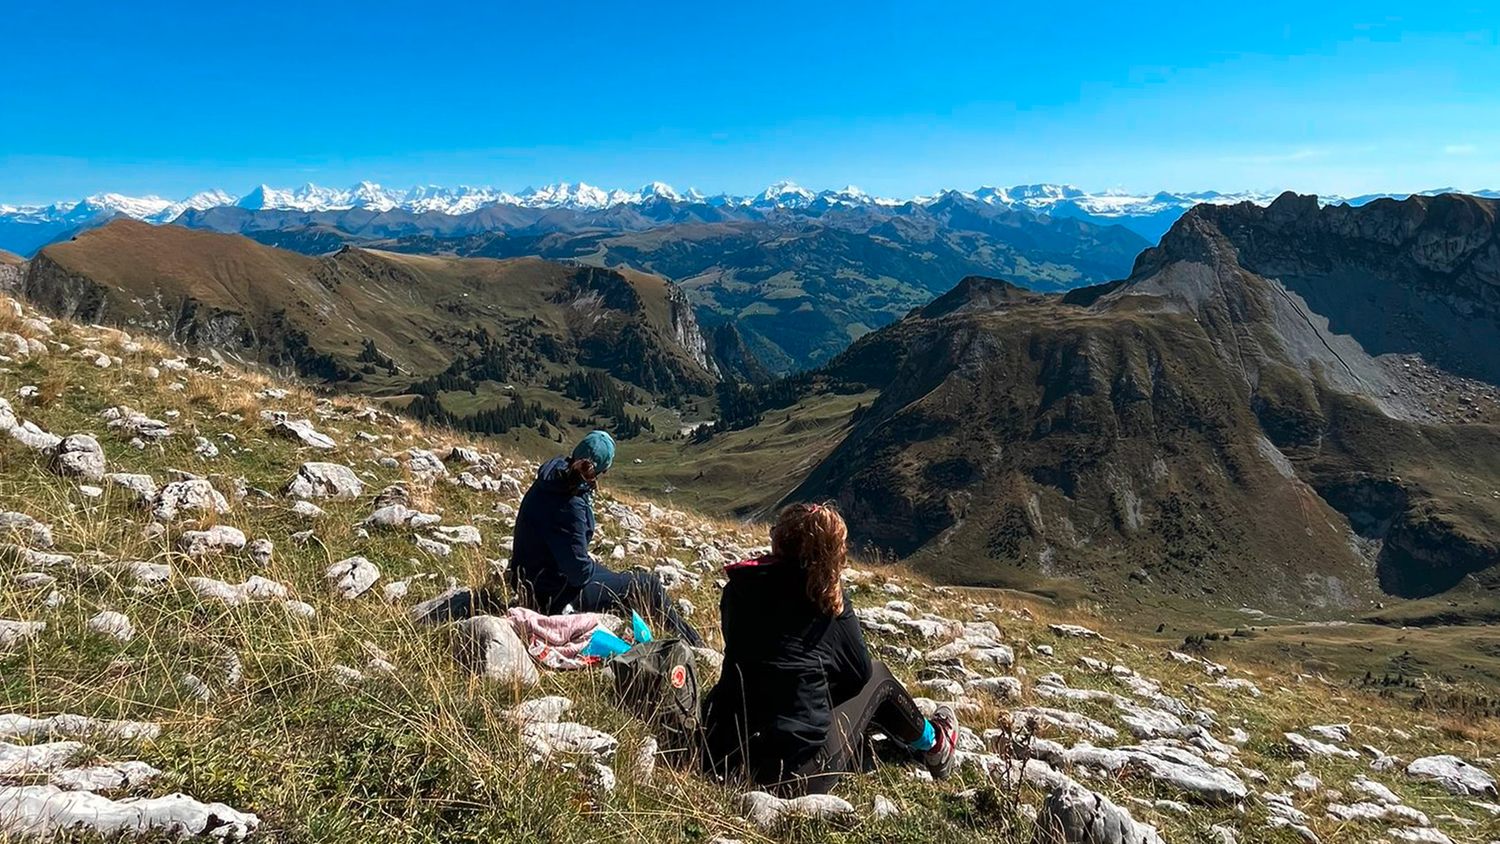
Elisa and Oli plan their hike with the help of the national map and make optimal use of the symbols.
Contour lines
Did you know that hikers sometimes must turn back halfway because they overlooked contour lines when planning? Ascents or descents can also prove far longer and steeper than anticipated. To avoid surprises during outdoor adventures, it’s crucial to accurately interpret terrain details, landmarks, and potential hazards on a map.
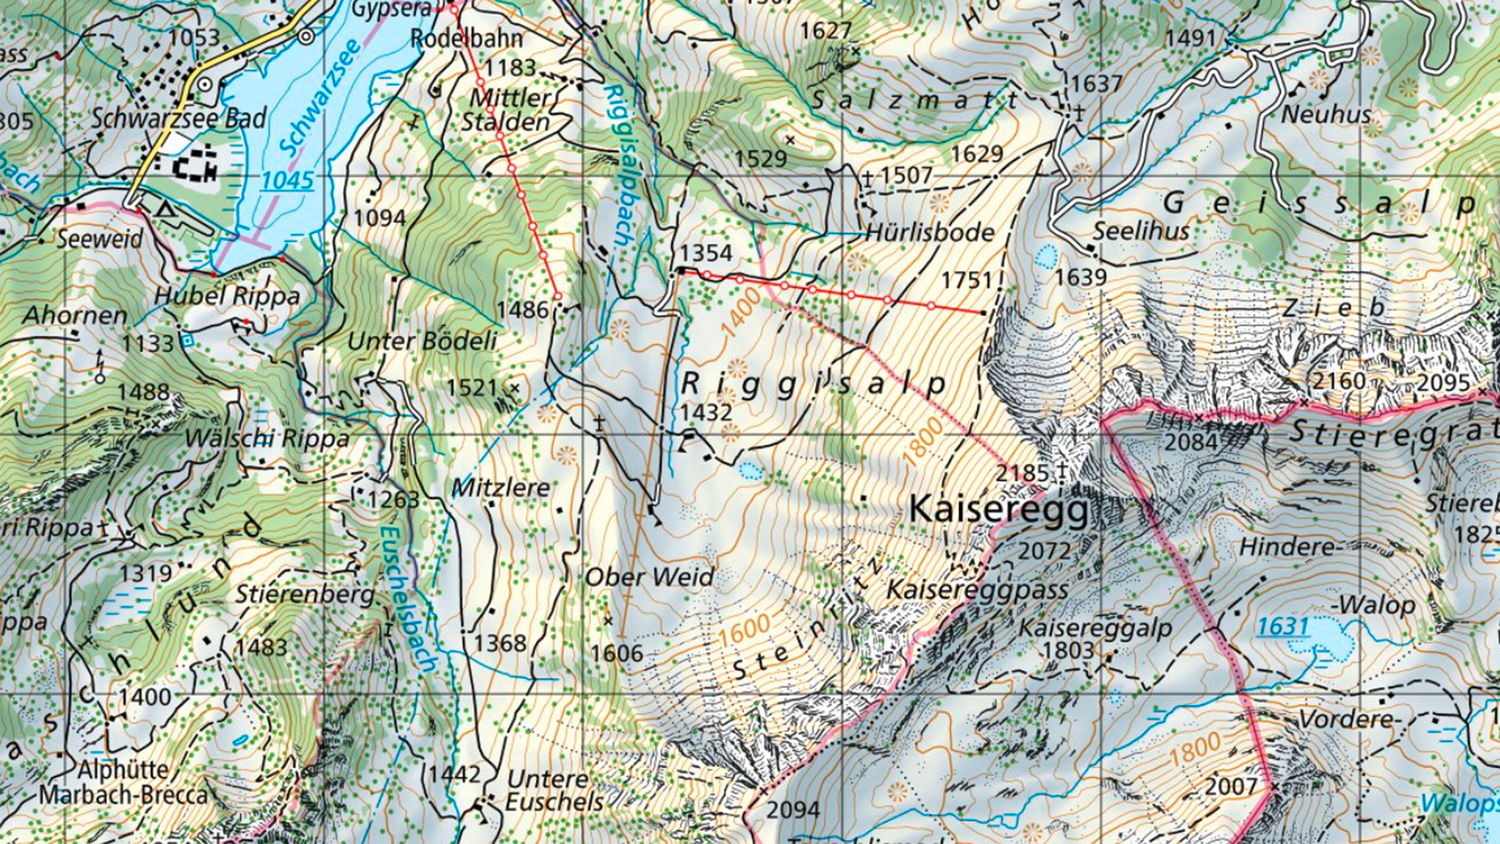
Examine the map extract around Kaiseregg: tightly spaced contour lines indicate steep slopes. In contrast, the wider gaps between lines on Riggisalp signal gentler terrain.
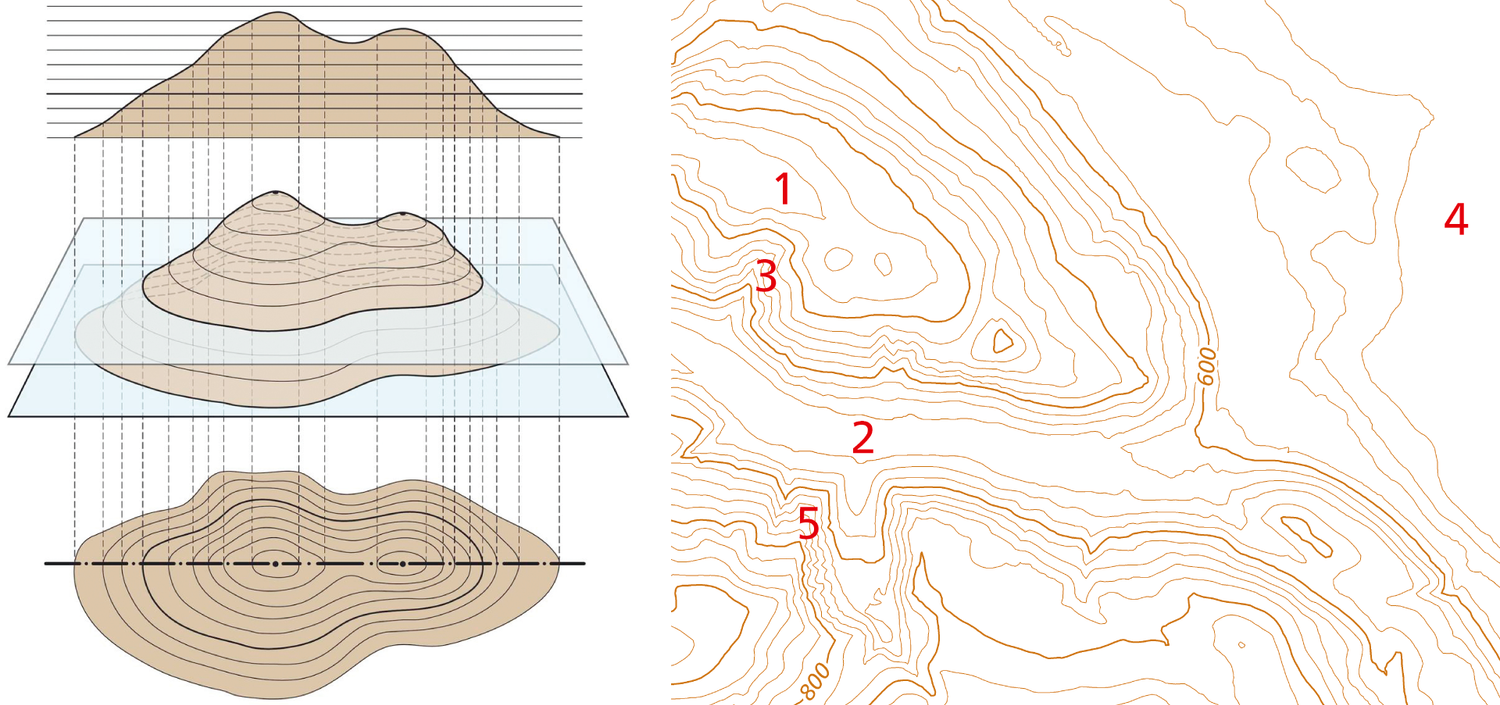
Features of the terrain such as ridges (1), valleys (2) or troughs (3) can be identified from their course and distance. Basically: The farther apart the contour lines are, the flatter the terrain (4). The closer the contour lines are, the steeper the terrain (5).
To this end, take a look at the map section around Kaiseregg. The lines are very close together here – which means that there are steep passages. In comparison, the distances between the contour lines on the Riggisalp are wider and the terrain is flatter.
Orientation in nature
Forest

Scattered forest / Isolated tree

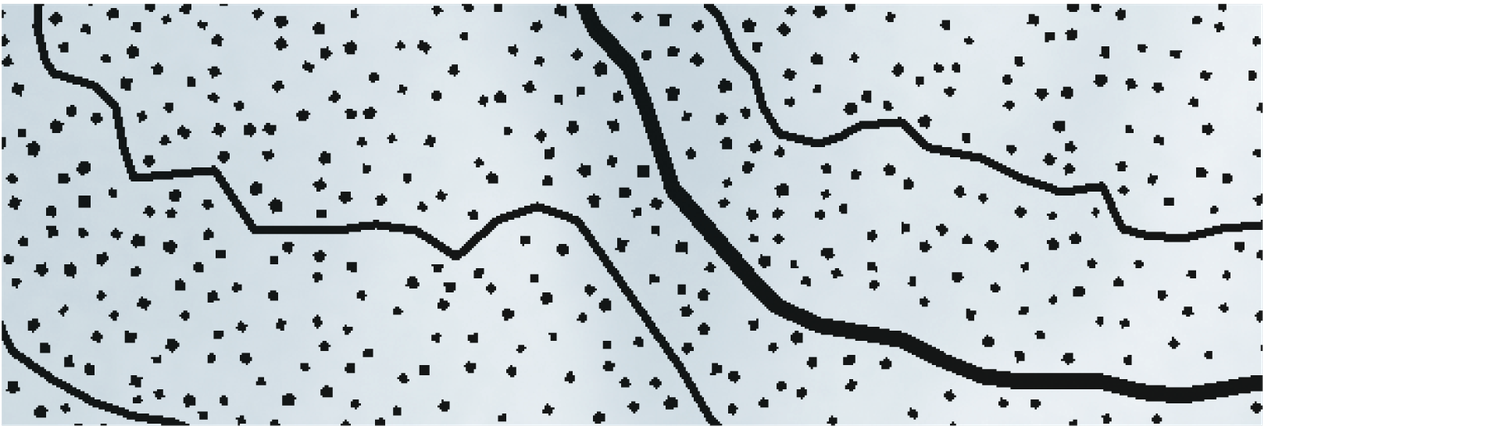
Boulder fields
Contour lines

Equidistance
Now that you can evaluate slope steepness, how do you determine elevation gain? The map’s contour interval – the vertical distance between adjacent contour lines, also known as equidistance – holds the answer.
The following equidistances apply to national maps:
- 1:10,000 = 10 m
- 1:25,000 = Swiss Mittelland, Jura: 10m/Alps: 20m
- 1:50,000 = 20 m
- 1:100,000 = 50 m
- 1:200,000 = 100 m
Calculation example
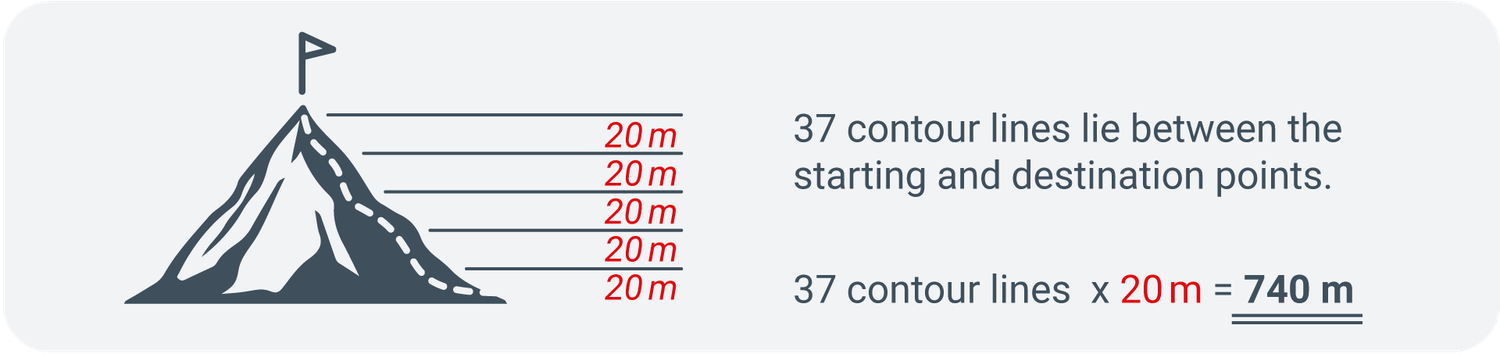
The Kaiseregg map extract uses a 1:50,000 scale with a 20-metre contour interval. Each line represents a 20-metre elevation change. Your hike from Riggisalp to Kaiseregg’s summit crosses 37 contour lines. 37 lines × 20 m = 740 m
This equals a total elevation gain of approximately 740 metres.
How steep will the path be, and how many metres of ascent must be tackled? These are questions hikers must ask themselves when planning a route. Understanding contour lines, woodland, and scree is an essential part of map reading.
Whether you’re planning a long hike or a short outing, your knowledge of these features will help you navigate and reach your destination safely.
Map reading is in!
Map reading is not only a useful skill for all outdoor enthusiasts but also helpful for planning. With a bit of practice and the right information, you can organise your trips even better and impress your friends with your expertise. Incidentally, our famous Swiss national maps are among the most detailed and accurate in the world. By the way: it doesn’t matter whether you use the swisstopo map on your smartphone or as a paper map, as the legend stays consistent.
Would you like to know more? Further information can be found in the legend (also called the “key”) for all swisstopo maps: Map reading | swisstopo online shop (admin.ch)
Federal Office of Topography swisstopo
Seftigenstrasse 264
3084 Wabern