
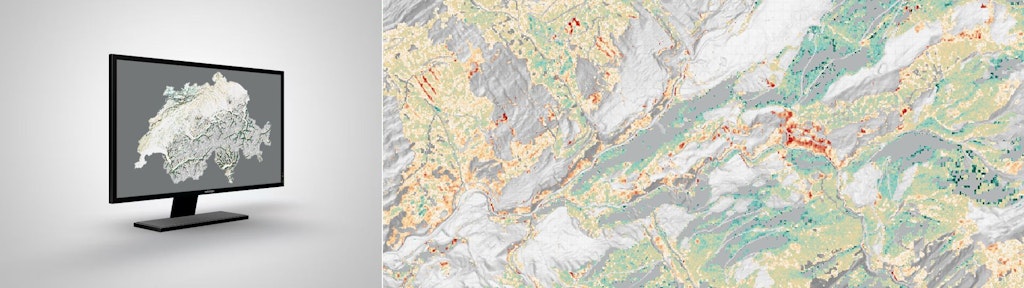
swissEO NDVIdiff
The difference in the “Normalized Difference Vegetation Index” (NDVI) shows the annual change in forest areas, derived from satellite data.
NDVI differences provide insights into yearly changes in forests, as NDVI approximates the chlorophyll content (the “greenness”) of vegetation. Chlorophyll absorbs red light, since this wavelength is used for photosynthesis. The healthier—and usually greener—the plant, the higher its chlorophyll content and the greater its absorption of red light. In addition, healthy plants reflect a larger portion of near-infrared light than stressed or diseased plants. Therefore, the NDVI can be calculated from the ratio of red and near-infrared light components, with higher NDVI values indicating healthier vegetation.
For practical use, NDVI values from two consecutive years are compared. The NDVI values from the previous year’s period are subtracted from those of the current period to obtain a measure of annual change. The greater the difference, the more extreme the change between years.
Positive differences indicate early leaf development, general tree growth, or recovery after a stressful year. Negative differences result from early leaf discoloration, windthrow, forest fires, disease or insect infestations, or other natural (e.g., drought stress) or human-made phenomena (such as forest management measures like logging or land-use changes).
Interpreting NDVI changes therefore requires knowledge of local events and the conditions of the previous year.
Data representation and availability
The current dataset can be viewed in the BGDI map viewer via: https://map.geo.admin.ch/?layers=ch.swisstopo.swisseo_ndvi_diff_v100 . In the BGDI WMS the dataset can be displayed by using the layer «ch.swisstopo.swisseo_ndvi_diff_v100» .
To display older datasets in the BGDI map viewer, URL parameterization is required. Replace in the following link with the end date of data acquisition in the format yyyy-mm-ddT235959 (example: 2023-09-30T235959):
Example for the dataset of August/September 2023:
Further information
Access to raw data
The data can be accessed via the STAC Collection «ch.swisstopo.swisseo_vhi_v100» in the STAC interface of BGDI:
- Browser and download interface: swissEO NDVIdiff: NDVI change (admin.ch)
- Download API documentation: REST Interface: Spatial Temporal Asset Catalog API (admin.ch)
- Google Earth Engine: NDVI difference Image Collection [projects/satromo-prod/assets/col/NDVIdiff_SWISS]
- Accessing STAC via Python - Introduction (Jupyter Notebook)
- Image processing using Python with STAC (Jupyter Notebook)
- Streaming swissEO products in QGIS
Terms of use
swissEO may be used, distributed and made accessible. Furthermore,it may be enriched and processed and also used commercially. A reference to the source is mandatory. In the case of digital or analogue representations and publications, as well as in the case of dissemination, the following source references must be attached in any case:
© swisstopo, Contains modified Copernicus Sentinel data [Year]
Further information on the terms of use can be found on the terms of use webpage.
Index
Federal Office of Topography swisstopo
Seftigenstrasse 264
3084 Wabern